
Aviation Emissions Statistics 2026: CO2, Contrails and the Path to Net Zero
Updated September 14, 2026 · 12 min read
Last updated: August 31, 2026 — figures from Our World in Data, ATAG, IATA and peer-reviewed radiative-forcing research.
This page collects the key aviation emissions numbers in one citable place: how much CO2 flying produces, its true share of warming including contrails, how the trend line moves, and what the decarbonization levers actually deliver. Every figure links to a primary source.
Aviation emissions — the headline numbers
- Flights emit roughly 880-1,000 million tonnes of CO2 per year — about 2.5% of global CO2.
- Including contrails and other non-CO2 effects, aviation accounts for roughly 4% of human-caused warming to date.
- Aviation emissions doubled from ~0.5 Gt (1990) to ~1 Gt (2019) and are climbing back to that peak after the pandemic dip.
- Sustainable aviation fuel covered just ~0.7% of airline fuel in 2025 (2.1 million tonnes).
- Roughly 1% of the world population causes ~50% of aviation emissions — frequent flying is highly concentrated.
- IATA’s industry target: net-zero carbon by 2050, mostly via SAF.
Global Aviation Emissions Over Time
The long-run trend of aviation emissions is a near-uninterrupted climb, broken only by 9/11, the 2008 crisis and — dramatically — the 2020 pandemic:
| Year | Aviation CO2 (approx.) | Context |
|---|---|---|
| 1990 | ~0.5 billion tonnes | Baseline of the modern era |
| 2019 | ~1.0 billion tonnes | Pre-pandemic peak — doubled in 30 years |
| 2020 | ~0.6 billion tonnes | COVID collapse (−40%) |
| 2023 | 882 million tonnes | Recovery under way (OWID) |
| 2025-2026 | approaching ~1 billion again | Traffic above 2019 in most regions |
A sentence worth quoting: per-seat efficiency improves about 1-2% a year, but traffic has grown faster — so total aviation emissions keep rising despite better aircraft.
Aviation Emissions as a Share of the Climate Problem
| Measure | Aviation’s share | Source |
|---|---|---|
| Global CO2 emissions | ~2.5% | Our World in Data |
| Global warming to date (incl. non-CO2) | ~4% | OWID / Lee et al. 2021 |
| Aviation’s own warming from non-CO2 effects | ~2/3 of its total effect | Lee et al. 2021 |
| Share of world population flying internationally in a year | Minority — frequent flyers dominate | OWID |
The non-CO2 story is the least understood part: contrail cirrus alone likely warms more than aviation’s CO2 in the short term. Our guides to aviation non-CO2 effects and contrail avoidance cover the mechanisms and the surprisingly cheap operational fixes.
Where Aviation Emissions Come From
| Segment | Approximate share of aviation CO2 | Decarbonization lever |
|---|---|---|
| Long-haul passenger (>4,000 km) | Largest share — few flights, huge fuel burn | SAF only, for now |
| Short/medium-haul passenger | Substantial | SAF now; electric aircraft and hydrogen aviation from the 2030s |
| Freight | ~15-20% | SAF, efficiency, modal shift |
| Private/business aviation | Small in total, extreme per passenger | Electrification suits short hops first |
The Decarbonization Levers, Ranked by the Numbers
Four levers exist; the aviation emissions math treats them very differently:
| Lever | 2025 status | Realistic contribution by 2050 |
|---|---|---|
| Sustainable aviation fuel | 2.1 Mt = ~0.7% of fuel | The workhorse — IATA scenarios lean on SAF for ~65% of cuts; see the SAF mandate |
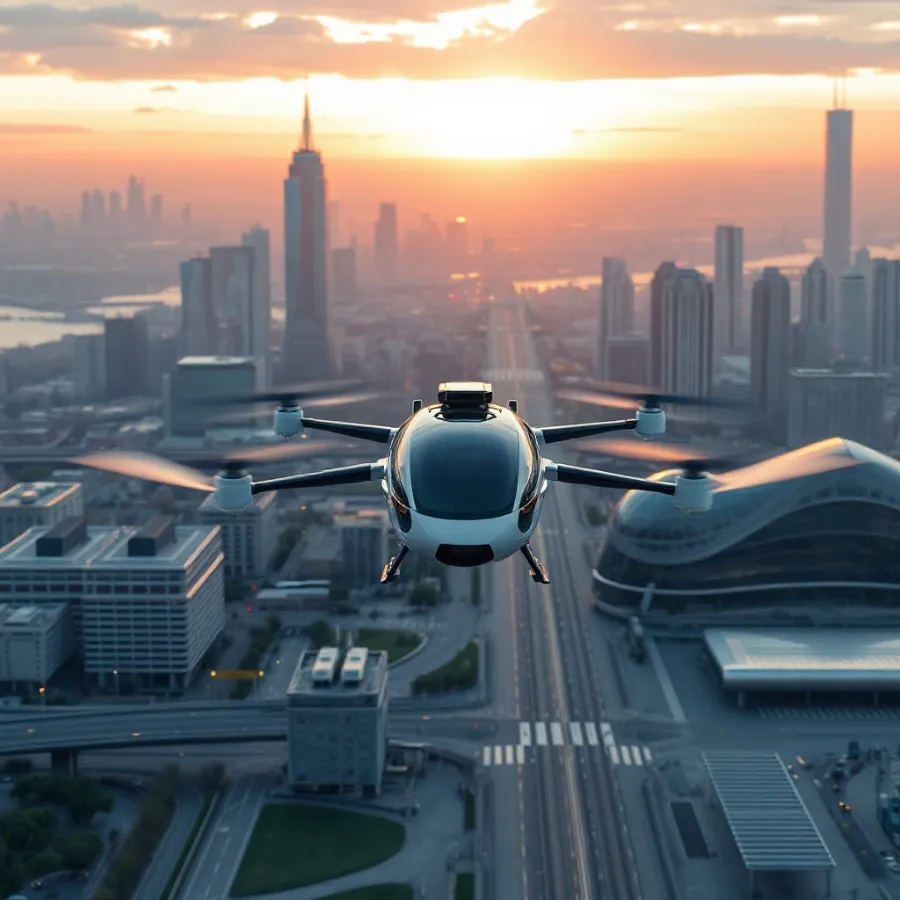
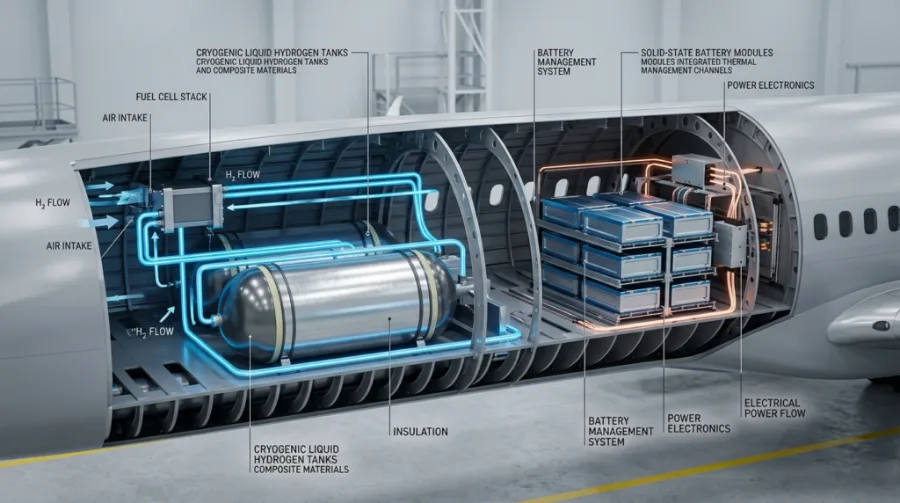
| New propulsion (electric, hydrogen) | Certified trainers; regional aircraft in testing | Meaningful on short routes from the 2030s |
| Operations & contrail avoidance | Trials under way | Cheap, fast non-CO2 wins — small fuel cost, large warming cut |
| Offsets (CORSIA) | First phases running | Bridge mechanism, not a destination — see CORSIA explained |
Policy pressure is the forcing function: intra-European flights pay for carbon under the EU ETS, and international routes fall under CORSIA offsetting — both raise the cost of unabated aviation emissions every year.
Aviation Emissions Compared With Other Transport
Per passenger-kilometre, flying sits near the top of the emissions table — but the comparison depends heavily on distance and load. A full narrow-body on a 1,500 km route can beat a solo driver in a large gasoline car per km, while short feeder flights are hard to defend against rail. The honest summary: where high-speed rail exists, it emits a small fraction of the equivalent flight; where it doesn’t, aircraft efficiency and SAF are the only levers. Our CO2 emissions per mile by vehicle type guide has the mode-by-mode numbers, and the ground-transport equivalent of this page lives at EV statistics.

Aviation Emissions by Country
National aviation emissions statistics are dominated by a handful of large, wealthy, or geographically vast markets. The United States is the single largest emitter from aviation by a wide margin, driven by an enormous domestic network; China ranks second and grows fastest; the UK, Japan, Germany and the UAE follow, the last as a transfer-hub effect rather than local demand. Distribution is the sharper story: analyses summarized by Our World in Data suggest that only a minority of the world’s population flies internationally in a given year, and that roughly 1% of people — the frequent flyers — account for about half of aviation emissions from passenger travel. The country-by-country table lives in our dedicated aviation emissions by country guide.
| Pattern | What the data shows |
|---|---|
| Largest national emitter | United States (domestic network scale) |
| Fastest structural growth | China and Southeast Asia |
| Highest per-capita flying | Small wealthy/hub states (UAE, Singapore, Iceland-type profiles) |
| Concentration | ~1% of world population ≈ ~50% of passenger aviation emissions |
Per-Passenger Aviation Emissions: What One Trip Costs
Translating a billion tonnes into personal terms makes the numbers usable. A reasonable planning figure for modern, reasonably full economy flying is on the order of 90-110 kg CO2 per hour in the air; premium cabins multiply that by the extra floor space (business ≈ 2-3x economy per seat). That yields these order-of-magnitude aviation emissions per trip:
| Trip (economy, one way) | Approx. CO2 per passenger | Equivalent in car terms |
|---|---|---|
| 1-hour domestic hop | ~100 kg | ~500 km in an average gasoline car |
| 3-hour continental flight | ~250-300 kg | ~1,500 km of driving |
| Transatlantic (7-8 h) | ~500-700 kg | Several months of typical driving |
| Long-haul Asia-Europe (11-12 h) | ~900-1,100 kg | ~half a typical car’s annual CO2 |
These are CO2-only; multiplying by ~2-3 approximates the full warming effect with contrails included, which is why a single long-haul round trip can rival a year of driving in climate terms. For calculating your own totals, see calculate your carbon footprint and air travel carbon footprint.
Myths vs the Aviation Emissions Data
“Aviation is only 2%, so it doesn’t matter.” The 2.5% CO2 figure understates flying three ways: non-CO2 effects lift the warming share toward 4%; the sector is growing while others shrink, so its relative share rises every year; and the emissions are concentrated among few people, making them unusually addressable.
“New planes will fix it.” Fleet efficiency improves 1-2% a year; traffic historically grew 4-5%. Efficiency alone has never bent the absolute curve downward — only fuel substitution (SAF), new propulsion, and demand-side change can.
“Offsets make flights carbon-neutral.” Offset quality varies enormously, and CORSIA covers only growth above a baseline, not total aviation emissions. Offsets are a bridge; treating them as absolution is exactly what the scheme’s own designers warn against — our offset vs credit explainer unpacks the difference.
“Electric planes are about to replace jets.” Certified electric aircraft fly today — as 2-seat trainers and short-hop air taxis. Physics caps battery flight near 500 km for now; hydrogen extends that regionally in the 2030s; long-haul stays liquid-fueled for decades, which is why SAF carries the plan’s weight.
Methodology and Update Policy
Figures on this page come from Our World in Data’s aviation dataset (based on international energy statistics), ATAG’s industry fact sheet, IATA publications, and the peer-reviewed radiative-forcing literature (Lee et al. 2021 for non-CO2 shares). Measured years are labeled; forward figures are explicitly scenarios. The page is updated when the underlying datasets refresh, per our editorial policy.
The newest zero-emission aircraft category gets its own reality check in our eVTOL guide.
To run these numbers on your own life, our step-by-step guide to calculate your carbon footprint includes the flight factors used here.
How future fuels alter the contrail line of this ledger: see hydrogen contrails.
Aviation is one slice of these national totals — see our CO2 emissions country ranking for the full picture.
How are aviation emissions actually measured?
Almost every figure on this page ultimately comes from one quantity: fuel uplift. Aircraft emissions are not measured in the exhaust; they are calculated from how much jet fuel was loaded, using a combustion factor that is stable and well characterised — burning a kilogram of jet fuel produces close to 3.16 kg of carbon dioxide, regardless of engine or aircraft. That single conversion is why aviation CO2 data is more reliable than most sectors.
Where the numbers diverge is in what gets counted and who it is assigned to.
| Method | Data source | Strength | Weakness |
|---|---|---|---|
| Fuel-sales statistics | National energy balances | Complete for fuel sold in a country | Says nothing about where the aircraft flew |
| Operator reporting | Airline fuel records under compliance schemes | Accurate per flight, independently verified | Only covers routes inside the scheme’s scope |
| Flight-movement modelling | Radar and flight-plan data plus aircraft performance models | Route-level and near real time | Depends on modelled fuel burn, not measured uplift |
| Inventory reporting | National greenhouse-gas inventories | Internationally standardised | International flights are reported separately from national totals |
That last row is the single biggest source of confusion in aviation statistics, and it deserves its own section.
Why do national aviation figures disagree with each other?
Under international inventory rules, fuel used for international flights and shipping — “international bunkers” — is reported separately and is not included in a country’s national emissions total. Only domestic aviation sits inside the headline number. So a country with a large international hub can appear to have modest aviation emissions while enormous quantities of fuel are uplifted at its airports.
Three different answers to “how much does country X emit from flying?” are all defensible:
- Territorial, domestic only. What appears in the national inventory total. Smallest number; excludes every international departure.
- Departures-based. All flights leaving that country’s airports, usually counting the full flight. The convention behind most international comparisons, including the country table above.
- Residence-based. All flights taken by that country’s residents, wherever they board. Largest number for wealthy countries with outbound tourism; rarely published because it requires survey data.
A country can rank very differently under each. When a statistic surprises you, check which convention produced it before concluding anything — and be sceptical of any comparison that does not say. We state the convention for every figure we publish on our methodology page.
What does one person’s flying add up to?
National totals hide an extremely uneven distribution. A minority of people take most of the flights, and within that minority a small group flying long-haul in premium cabins accounts for a disproportionate share again. The calculator below turns a year of typical travel into a figure you can compare against national per-capita emissions.
Annual flying footprint estimator
Assumptions: a short-haul return is treated as 2,400 km total at 0.126 kg CO2e per passenger-km; a long-haul return as 11,000 km total at 0.117 kg per passenger-km. Both factors include the official non-CO2 multiplier. Your actual routes will differ — use the flight emissions calculator for a specific itinerary.
The result is worth sitting with, because it reframes the policy debate. Aviation is a small share of global emissions and simultaneously the dominant line in the personal footprint of frequent flyers. Both statements are true, and arguments about aviation usually founder on people quoting one at someone quoting the other.
What do the numbers look like per aircraft rather than per passenger?
Per-passenger figures are the right unit for travel decisions, but they hide how the fleet actually consumes fuel. A widebody on a long-haul sector burns fuel at a rate that dwarfs anything in surface transport, and it does so for many hours continuously.
| Aircraft class | Typical fuel burn | Typical seats | What that means per seat-hour |
|---|---|---|---|
| Light piston trainer | ~30 litres per hour | 2 | High per seat, tiny in absolute terms |
| Regional turboprop | ~600 kg per hour | 50-78 | The most efficient conventional option on short sectors |
| Narrowbody jet | ~2,400 kg per hour | 150-200 | Efficient per seat when full; the workhorse of the fleet |
| Widebody twin | ~5,000-6,500 kg per hour | 250-350 | Comparable per seat to a narrowbody, over far greater distance |
Two lessons. Per seat-kilometre, modern jets are remarkably efficient — the problem is the number of kilometres, not the efficiency of each one. And turboprops beat jets decisively on short sectors, which is why short-haul decarbonisation discussions keep returning to aircraft type and to rail substitution rather than to new propulsion.
What should you be sceptical of in aviation emissions reporting?
- Percentages without a denominator. “Aviation is 2-3% of emissions” means CO2 only, globally, in a pre-pandemic baseline year. Change any of those three and the number changes.
- Efficiency improvements quoted per seat. Fuel burn per seat-kilometre has fallen steadily for decades while total emissions rose, because traffic grew faster. Both facts are real; only one is usually quoted.
- Fleet averages applied to a specific flight. A route flown by an older aircraft at low load factor can be far worse than the average implies.
- Any figure without a year. Aviation data has a pandemic-shaped hole in it. Comparisons that straddle 2020-2022 without saying so are meaningless.
- Non-CO2 effects quietly dropped. A CO2-only total is roughly a third of the warming impact. That is a defensible boundary if stated, and misleading if not.
Every table on this page states its year, its scope and its source for exactly this reason. Where we use a figure whose convention differs from the rest of the page, the table says so in the row.
Frequently Asked Questions
How to cite this page
This page is free to cite, quote and link to — for a research guide, a class handout, a news story or a report. No permission is needed and there is no paywall. If it is useful to your readers, a link is all we ask.
Suggested citation:
ZeroCarbonDrive. Aviation Emissions Statistics. Available at: https://zerocarbondrive.com/aviation-emissions-statistics/
Figures are compiled from published aviation and climate sources and updated when those sources release new data. Every figure on this page carries its primary source inline, so you can verify any number before you repeat it. If you find one that is out of date or wrong, tell us and we will correct it and say so — our editorial policy covers how corrections are handled.
What percentage of global CO2 comes from aviation?
Aviation produces about 2.5% of global CO2 emissions — roughly 880-1,000 million tonnes a year against ~43 billion tonnes from all human activity. Counting non-CO2 effects such as contrails, aviation has contributed around 4% of observed warming to date.
How much CO2 does one flight emit per passenger?
A rough rule: about 90-110 kg CO2 per passenger-hour of economy flying on a modern full aircraft — so a one-way transatlantic economy seat is on the order of 500-700 kg CO2, before non-CO2 effects. Exact numbers depend on aircraft, load factor, and class.
Are aviation emissions growing?
Yes — from ~0.5 billion tonnes in 1990 to ~1 billion in 2019; after the 2020 pandemic collapse, emissions have risen again each year as traffic recovered. Efficiency gains per seat have been outpaced by traffic growth.
What are non-CO2 aviation effects?
Contrails, NOx, and water vapour at altitude add warming beyond CO2 — research (Lee et al. 2021) attributes roughly two-thirds of aviation\u0027s total warming effect to these non-CO2 mechanisms, with contrail cirrus the largest single component.
How much sustainable aviation fuel is produced?
SAF output reached about 2.1 million tonnes in 2025 — only ~0.7% of airline fuel use. Mandates like ReFuelEU are designed to scale that share through the 2030s.
What is aviation\u0027s net-zero plan?
IATA member airlines committed to net-zero carbon by 2050, built on SAF (the largest share), new propulsion (electric and hydrogen aircraft), operational efficiency, and offsets via CORSIA for the remainder.
Sources and Further Reading
- Our World in Data — What share of global CO2 comes from aviation?
- ATAG — Aviation facts & figures
- IATA — Sustainability and net-zero commitment
- Lee et al. (2021) — The contribution of global aviation to anthropogenic climate forcing
Where this fits
This page is part of the zero-carbon aviation hub on ZeroCarbonDrive:
- Zero-carbon aviation hub: the four routes, and what is certified
- Aviation non-CO2 effects
- Sustainable aviation fuel explained
Work it out yourself
Related tools and method notes on ZeroCarbonDrive:
Every figure on this page is dated and linked to its source. How we verify · Editorial policy · Report a correction
Related Posts

Leave a Comment
Your comment will be published after it has been approved. Please send comments that do not contain slang words.