
EV Statistics 2026: Sales, Batteries, Charging and Emissions Data

Updated September 26, 2026 · 12 min read
Last updated: August 31, 2026 — figures reflect the IEA Global EV Outlook 2026 and BloombergNEF’s December 2025 battery price survey.
Looking for reliable EV statistics in one place? This reference page collects the most important, source-verified numbers on electric vehicles: global sales, market share by region, battery prices, charging infrastructure, and emissions. Every figure links to its primary source — cite freely with attribution.
EV statistics — the headline numbers
- 20+ million electric cars were sold worldwide in 2025 — one in four new cars (IEA).
- The IEA projects 23 million EV sales in 2026, a 28% global market share.
- Average battery pack prices fell to $108/kWh in 2025; BEV packs hit $99/kWh (BloombergNEF).
- The world passed 7 million public charging points in 2025, with 1.8 million added in a single year.
- China accounts for ~55% of its own new-car sales being electric and ~65% of the world’s public chargers.
- Chinese automakers supplied about 60% of all electric cars sold globally in 2025.
Global EV Sales Statistics, Year by Year
Of all EV statistics, the sales curve is the most quoted. Electric car sales have grown roughly sevenfold in six years. The trajectory below uses IEA Global EV Outlook data (each year’s figure as reported in that year’s edition):
| Year | Global EV sales | Share of new cars |
|---|---|---|
| 2020 | ~3 million | ~4% |
| 2021 | 6.6 million | ~9% |
| 2022 | 10.5 million | ~14% |
| 2023 | ~14 million | ~18% |
| 2024 | ~17 million | ~20% |
| 2025 | 20+ million | ~25% |
| 2026 (IEA projection) | 23 million | ~28% |
One sentence worth quoting: in 2025, one in every four new cars sold on Earth was electric — and the IEA expects that to reach more than one in four in 2026.
EV Statistics by Region: Market Share
| Region | EV share of new-car sales (2025) | Trend |
|---|---|---|
| China | ~55% | Growth slowing but dominant; majority of sales now electric |
| Europe | 28% | Fastest growth among major markets in 2025 (+30%) |
| United States | ~10% (2024 baseline) | Lagging the global boom after incentive changes |
| World | ~25% | +20% sales growth year over year |
On the supply side, Chinese automakers provided around 60% of the electric cars sold globally in 2025; European and North American manufacturers held roughly 15% each. For what this means for buyers, see our upcoming guide to Chinese electric cars, and for the policy backdrop, our EU ETS explainer shows how carbon pricing shapes transport markets.
EV Battery Price Statistics
Among EV statistics, battery cost is the single most important number, because it drives sticker price. BloombergNEF’s annual survey is the industry benchmark:
| Metric (2025 survey) | Value |
|---|---|
| Average pack price, all segments | $108/kWh (−8% vs 2024) |
| Battery-electric vehicle packs | $99/kWh — under $100 for the 2nd year |
| LFP chemistry average | $81/kWh |
| NMC chemistry average | $128/kWh |
| China average | $84/kWh (lowest region) |
| North America / Europe premium | +44% / +56% vs China |
| Stationary storage packs | $70/kWh (−45%, now the cheapest segment) |
The long-view EV statistics are even more striking: packs cost about $732/kWh in 2013, $137/kWh in 2020, $115/kWh in 2024 and $108/kWh in 2025 — a roughly 85% decline in a dozen years. The next inflection is solid-state chemistry; our comparison of solid state battery vs lithium ion covers where that stands.

EV Charging Infrastructure Statistics
| Metric (end of 2025) | Value |
|---|---|
| Public charging points worldwide | 7+ million |
| Added in 2025 alone | ~1.8 million (+33% growth) |
| China’s share of global public chargers | 65%+ (4.7 million points) |
| Netherlands (Europe’s leader) | ~210,000 points |
| Germany | ~196,000 points |
| France | ~185,000 points |
| IEA projection, 2026-2035 additions | 350+ million points (Current Policies Scenario) |
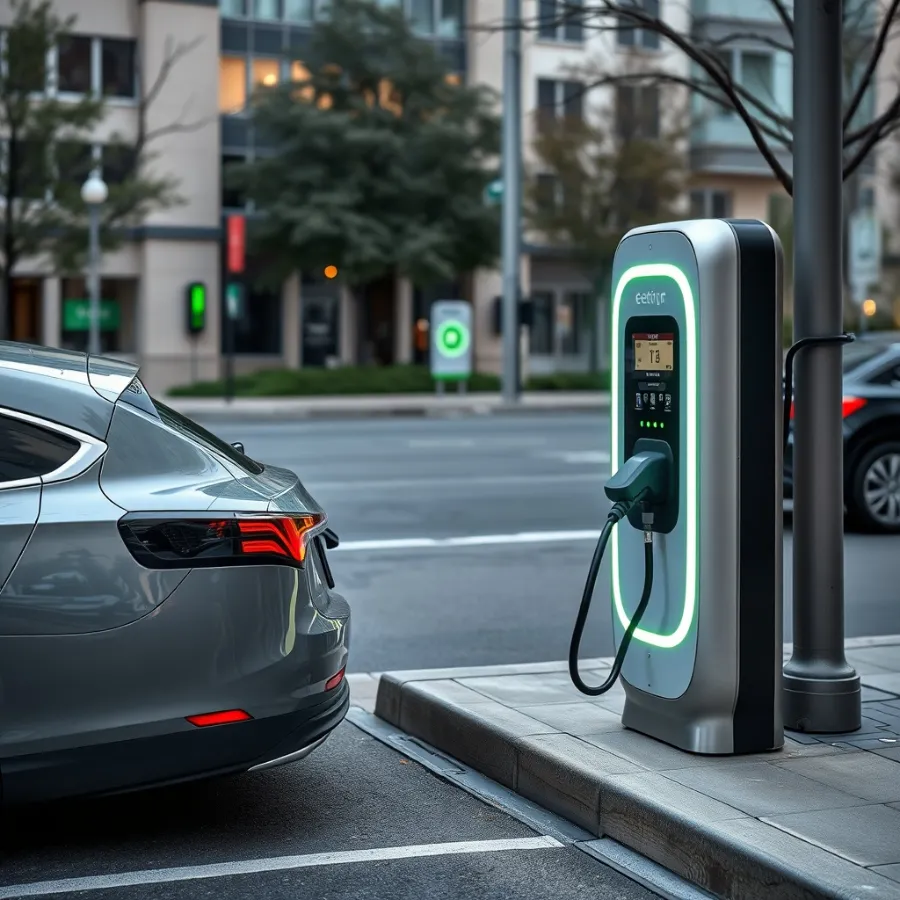
Most charging still happens at home — which is why home equipment matters more than the public totals suggest. Our guides to EV charger installation and EV charging at home cover the practical side.
Emissions: EVs vs Combustion Cars
Emissions EV statistics are the most contested, and the clearest: lifecycle analyses consistently find that a battery-electric car emits substantially less CO2 than a comparable gasoline car over its life — including battery manufacturing. The ICCT’s lifecycle work puts the advantage at roughly 60-70% on the average European grid, and even on coal-heavy grids EVs come out ahead over a typical ownership period. Manufacturing a pack creates an upfront carbon debt that driving pays back, typically within the first one to two years of average use.
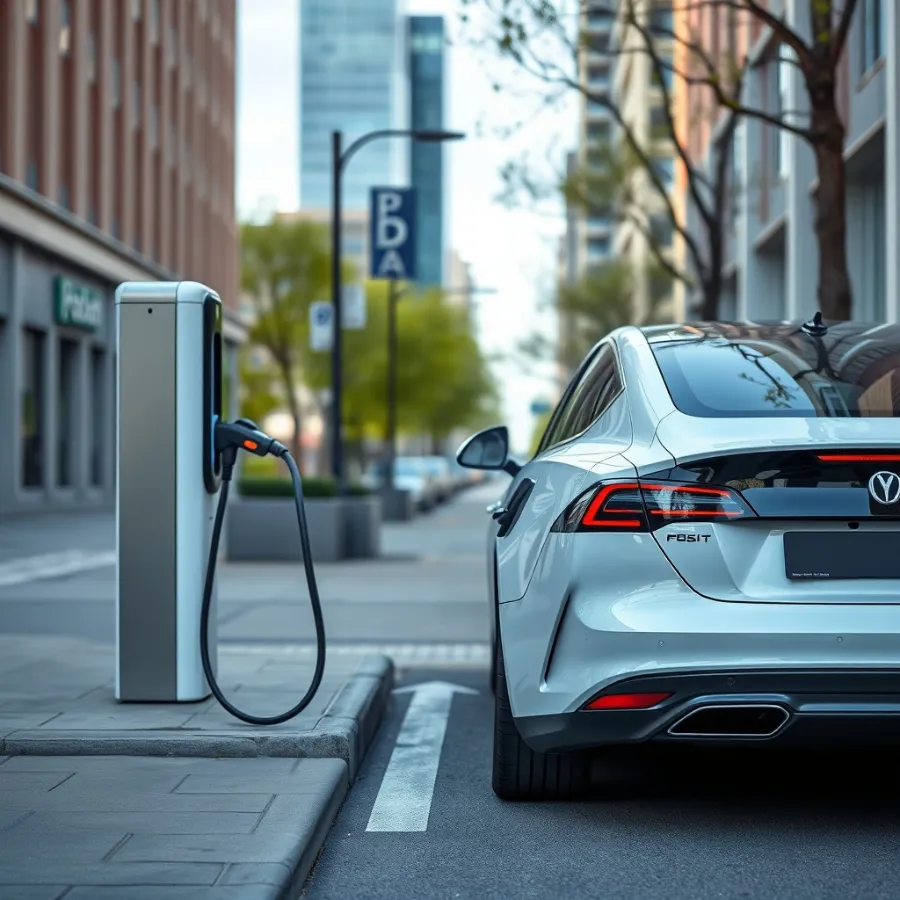
For the full methodology and numbers, see our deep dives on EV vs gas car lifecycle emissions and EV battery manufacturing emissions.
EV Statistics by Country: Sales and Adoption Leaders
Country-level EV statistics show wildly uneven adoption. Norway routinely reports that nearly all new cars sold are electric — the endgame every market watches. China is the volume giant: with roughly 55% of new sales electric and 11+ million units a year, its domestic market alone is bigger than the rest of the world combined. Europe’s 28% average hides a wide spread, from Nordic leaders to slower southern markets, while the United States sits near one in ten new cars, having decoupled from the global growth curve after federal incentive changes.
| Market | What the numbers say | Why it matters |
|---|---|---|
| Norway | ~90%+ of new cars electric | Proof that near-total adoption is possible with sustained policy |
| China | ~55% share, 60% of world supply | Sets global prices; exports reshape every other market |
| Netherlands | Europe’s densest charging (210k points) | Model for infrastructure-led adoption |
| Germany | 196k public points, top-3 EU sales | Largest EU car market in transition |
| United States | ~10% share | Growth now driven by state policy + price cuts, not federal credits |
Country-level emission context lives in our CO2 emissions per mile and EV tax credits by country guides.
What the EV Statistics Mean for Buyers
Three practical readings of these EV statistics. First, prices keep falling because packs keep getting cheaper.
Every $10/kWh decline cuts roughly $600 from the cost of a typical 60 kWh car, so the 2024→2025 drop alone is worth about $400 per vehicle before competition effects. Second, charging anxiety is aging out: with public points growing 33% a year and home charging covering most needs, the constraint has shifted from “can I charge” to “how fast.”
Third, chemistry choice is becoming visible at the showroom: LFP’s $81/kWh average is why entry-level trims increasingly use it, trading some cold-weather range for durability and price.
The statistics also explain the used market: batteries outlasting early fears (typical warranties 8 years/100,000 miles, real-world degradation commonly under 10-12% at that point per fleet studies) is steadily de-risking second-hand EVs — a theme our EV battery health guide covers in depth.
Where the EV Statistics Point Next
Forward-looking EV statistics are projections, not facts; trajectories are not. Three lines to watch through 2030, all from the sources below: the IEA’s central path takes global EV share from ~25% (2025) toward ~40%+ by 2030; BloombergNEF’s cost curve suggests average packs near $80/kWh by decade’s end as LFP and manufacturing scale compound; and the charging build-out — 350+ million additional points projected for 2026-2035 — implies charging capex overtaking many national grid-upgrade budgets. If solid-state batteries commercialize on schedule, the range and charging-speed statistics on this page will need rewriting — which is exactly what a living reference page is for.
Beyond Cars: Trucks, Buses and Two-Wheelers
Most EV statistics coverage stops at cars, but the widest electrification is happening on two and three wheels. Electric two- and three-wheelers — the workhorses of Asian cities — are the most electrified vehicle segment on the planet, with the majority of new sales in several Asian markets already electric. Electric buses follow: Chinese cities electrified their fleets years ahead of everyone else, and European transit agencies now routinely tender only electric. Heavy trucks are the frontier — battery prices at $108/kWh finally make regional electric freight pencil out, and megawatt charging standards are being built for exactly this segment, as our guide to megawatt charging for trucks explains.
| Segment | Electrification status | Bottleneck |
|---|---|---|
| Two/three-wheelers | Most electrified segment globally | None serious — economics already won |
| City buses | Mainstream in China, standard in EU tenders | Depot grid upgrades |
| Delivery vans | Rapid fleet adoption | Model availability, upfront cost |
| Regional trucks | Early commercial deployments | Megawatt charging build-out |
| Long-haul trucks | Pilots | Energy density + corridor charging |
Grid Impact: What 20 Million EVs a Year Means for Electricity
Grid-impact EV statistics defuse a common worry: EVs add demand gradually and mostly at night. A typical electric car consumes roughly 2,500-3,500 kWh a year — about a quarter of an average US household’s usage. Even aggressive adoption adds low single-digit percentages to national electricity demand per decade, well within normal grid planning, and smart charging turns EVs from a burden into a flexibility asset. Our guides to EV charging and grid emissions and V2G technology unpack how vehicle batteries are becoming grid storage.
All three of our free calculators (charging cost, road trip, charger payback) and the EPA efficiency table live on the tools page.
Myths vs the Data
“EV sales are collapsing.” The numbers say otherwise: +20% globally in 2025, a record 20+ million units. What changed is geography — US growth stalled while China and Europe accelerated, so a US-centric reading mistakes a regional plateau for a global one.
“Batteries die after a few years.” Fleet telemetry consistently shows modern packs retaining ~88-90% capacity at 100,000 miles; eight-year warranties are standard. Battery replacement horror stories are dominated by early-generation vehicles and accident damage, not normal wear.
“There’s nowhere to charge.” Public points grew 33% in one year to over 7 million, and most charging happens at home anyway. The honest version of this concern is regional: rural fast-charging gaps are real, city dwellers without driveways face genuine friction — but the trajectory is unambiguous.
“EVs are worse for the climate once you count the battery.” Lifecycle studies from the ICCT and others repeatedly settle this: even including manufacturing, an EV on an average European grid emits roughly 60-70% less CO2 over its life than a comparable combustion car, and the gap widens every year as grids decarbonize.
Methodology and Update Policy
This page aggregates EV statistics only from primary, citable institutions — the IEA’s annual Global EV Outlook (sales, shares, charging counts, projections), BloombergNEF’s annual battery price survey (pack and cell pricing), and ICCT lifecycle analyses (emissions). Where a precise 2025 figure was not yet published for a market, the most recent confirmed year is labeled explicitly rather than extrapolated. The page is revised when each new annual dataset lands — typically the battery survey each December and the EV Outlook each spring — and the last-updated line at the top reflects the newest incorporated source. Per our editorial policy, corrections are made promptly when readers flag discrepancies.
US-Specific EV Statistics Snapshot
Because most readers of this page search from the United States, the US-specific EV statistics deserve their own box. EV share of new-car sales sits near one in ten — roughly a third of the European rate and a fifth of China’s — after federal purchase credits ended in September 2025.
The US public-charging EV statistics tell a faster story: federally supported corridor sites (150 kW minimum, four stalls) keep opening along interstates, and the private networks profiled in our EV charging stations guide continue adding stalls at double-digit annual rates.
Meanwhile the sticker floor — the cheapest electric cars — dropped below $29,000 even without credits, and home-charging economics remain untouched by policy shifts: $2-3 per 100 km on residential rates. The American EV statistics story in one line: adoption paused at the policy level, kept compounding at the infrastructure and price level.
Quick-Reference EV Statistics Table
For readers who need one screenful of EV statistics to cite, this condensed table collects the headline figures from every section above, with the primary source for each:
| Statistic | Value | Source |
|---|---|---|
| Global EV sales, 2025 | 20+ million (+20% YoY) | IEA GEO 2026 |
| Global market share, 2025 | ~25% of new cars | IEA GEO 2026 |
| Projected sales, 2026 | 23 million (~28% share) | IEA GEO 2026 |
| China EV share of own market | ~55% | IEA GEO 2026 |
| Europe EV share, 2025 | 28% (+30% growth) | IEA GEO 2026 |
| Chinese makers’ share of world supply | ~60% | IEA GEO 2026 |
| Average battery pack price | $108/kWh (2025) | BloombergNEF |
| BEV pack price | $99/kWh | BloombergNEF |
| LFP / NMC pack averages | $81 / $128 per kWh | BloombergNEF |
| Public chargers worldwide | 7+ million (end 2025) | IEA |
| Chargers added in 2025 | ~1.8 million (+33%) | IEA |
| China’s share of public chargers | 65%+ (4.7M points) | IEA |
| Lifecycle CO2 advantage vs gasoline | ~60-70% lower (EU grid) | ICCT |
These EV statistics change on an annual publication rhythm, so treat any figure quoted elsewhere without a year label with suspicion — the difference between 2023 and 2025 numbers is enormous in this industry.
Why Reliable EV Statistics Are Hard to Find
Search results for EV statistics are crowded with recycled numbers: 2021 battery prices quoted as current, projections repeated as facts, and regional figures presented as global ones. Three habits keep the data honest. First, check the year — a “$137/kWh battery” claim is a 2020 figure, five years and 21% out of date. Second, check the geography — a statistic true of Norway or China is rarely true of the world.
Third, check whether a number is measured or modeled: the IEA clearly labels its scenarios (STEPS, APS, Current Policies), and a 2030 figure is always a scenario, never a measurement. Every table on this page follows those three rules, which is precisely what makes a statistics page citable rather than merely popular.
How to Cite These EV Statistics
All EV statistics on this page trace to primary sources listed below. When citing, name the original source (IEA, BloombergNEF, ICCT) — this page exists to make finding them faster. Journalists and researchers are welcome to link here as a maintained summary; the last-updated date at the top reflects the newest dataset incorporated.
For the home-hardware side of these numbers, see our Level 2 EV charger guide.
How those 7 million public points work in practice — networks, prices, reliability — is covered in our EV charging stations guide.
The 60% Chinese share of global supply gets its full story in our Chinese electric cars guide — brands, quality data and the tariff map.
What the falling pack prices mean at the showroom is ranked in our cheapest electric cars guide.
For the technology that could reshape these numbers after 2027, see our deep dive on the solid state battery vs lithium-ion transition.
The manufacturing debt behind those sales numbers is explained in our EV battery manufacturing guide.
How clean those sales actually are depends on the grid — see our EV emissions renewable energy guide.
Frequently Asked Questions
How many electric cars were sold in 2025?
More than 20 million electric cars were sold worldwide in 2025, about 20% more than in 2024, meaning one in every four new cars sold globally was electric, according to the IEA Global EV Outlook 2026.
What share of new cars are electric?
Globally, about 25% of new cars sold in 2025 were electric. The IEA projects 23 million EV sales in 2026, or roughly 28% of all new cars. In China the share is already near 55%; in Europe it reached 28% in 2025.
How much do EV batteries cost in 2026?
BloombergNEF\u0027s December 2025 survey put average lithium-ion pack prices at $108/kWh, with battery-electric-vehicle packs at $99/kWh — below the symbolic $100 threshold for the second year running. LFP packs averaged $81/kWh.
How many public EV chargers exist worldwide?
More than 7 million public charging points were installed globally by the end of 2025, after a record 1.8 million additions that year. China hosts over 65% of them (4.7 million).
Which country has the most EV chargers in Europe?
The Netherlands led Europe with about 210,000 public charging points at the end of 2025, followed by Germany (196,000) and France (185,000), per IEA data.
Are EV statistics updated on this page?
Yes — this reference page carries a visible last-updated date and is revised when major annual datasets (IEA Global EV Outlook, BloombergNEF battery survey) are released.
Sources and Further Reading
- IEA — Global EV Outlook 2026 (sales, shares, projections)
- IEA — Electric Vehicle Charging chapter (infrastructure counts)
- BloombergNEF — 2025 Lithium-Ion Battery Price Survey
- ICCT — lifecycle emissions analyses
well to wheel emissions is worth a closer look if you want the full picture.
connected vehicle data privacy is worth a closer look for the full picture.
electric vehicle motor types is worth a closer look for the full picture.
EV adoption by country is worth a closer look for the full picture.
EV emissions data is worth a closer look for the full picture.
Every figure on this page is dated and linked to its source. How we verify · Editorial policy · Report a correction
Related Posts


Leave a Comment
Your comment will be published after it has been approved. Please send comments that do not contain slang words.