
Urban Transport Emissions (2026): Where They Come From
Updated September 18, 2026 · 5 min read
Last updated: September 5, 2026
City emissions respond to traffic design and small vehicles: see smart traffic systems and our urban micro-mobility guide.
Quick answer: Urban transport emissions typically make up 20-30% of a city’s total carbon footprint, and within that, private cars usually account for the largest single share — often 50-70% of transport emissions despite carrying a minority of total passenger trips in dense cities. Public transit, walking and cycling carry a large share of trips while producing a small fraction of the emissions, which is why the single most effective urban emissions lever is mode shift: getting trips OFF single-occupancy cars, not just making cars cleaner.
Key takeaways
- Private cars are the disproportionate emissions driver in most cities — carrying fewer trips than transit/walking/cycling combined but producing the majority of transport emissions.
- Urban transport emissions per passenger-mile vary enormously by mode: rail and buses at capacity are far more efficient than a car carrying one person.
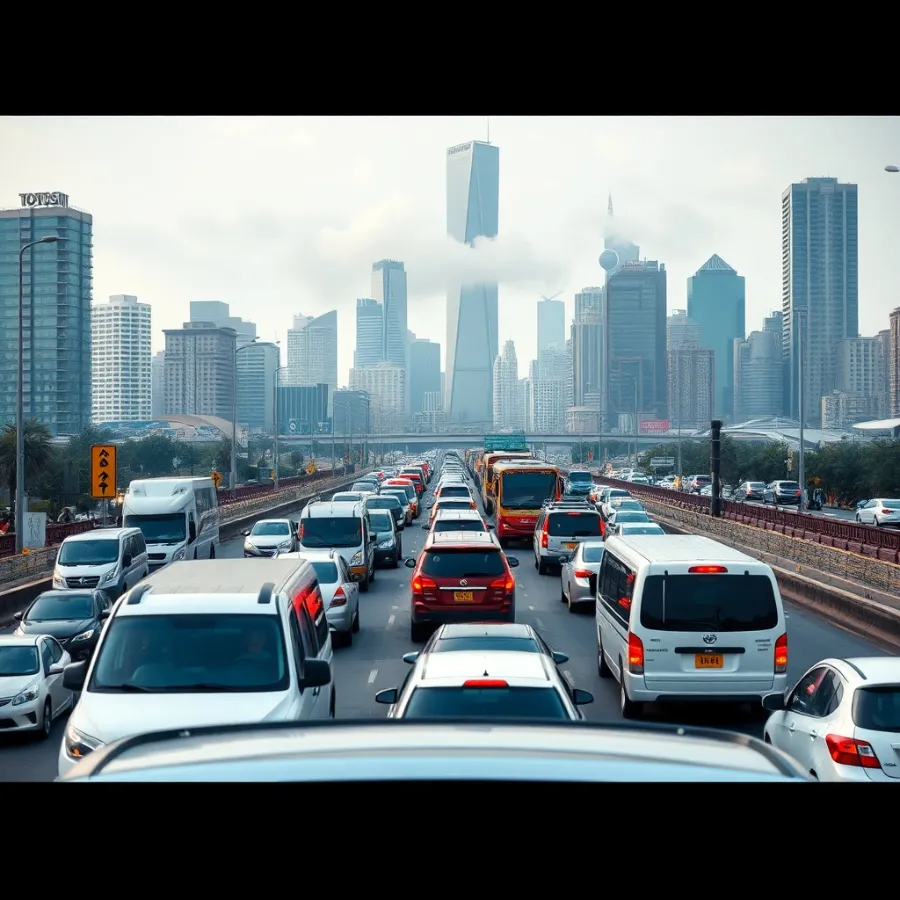
- Congestion itself adds emissions on top of distance traveled — stop-and-go driving burns more fuel per mile than free-flowing traffic.
- City-level interventions (transit investment, bike infrastructure, congestion pricing) move the needle more than individual vehicle choices alone.
Where Urban Transport Emissions Actually Come From
| Mode | Typical share of city trips | Typical share of transport emissions |
|---|---|---|
| Private cars (solo/low-occupancy) | Often a minority of trips in dense cities | Often 50-70% of transport emissions |
| Public transit (bus, rail) | A large share, especially in transit-rich cities | A small fraction, especially rail at capacity |
| Walking and cycling | A meaningful share of short trips | Essentially zero |
| Freight and commercial vehicles | Smaller trip count | A disproportionate share due to vehicle size and diesel use |
The mismatch between trip share and emissions share is the central fact of urban transport emissions: cars are emissions-expensive per trip in a way transit and active modes simply aren’t, which is why cities that successfully shift trips away from solo driving see outsized emissions reductions relative to the percentage of trips moved.
Why Congestion Makes It Worse
Distance traveled isn’t the whole story — HOW a trip happens matters too. Stop-and-go congested driving burns meaningfully more fuel per mile than free-flowing traffic, because engines run inefficiently at low speeds and constant acceleration wastes energy that smooth cruising doesn’t. This is why urban transport emissions studies consistently find that congestion-heavy corridors produce disproportionate emissions relative to their traffic volume — and why congestion-reduction measures (better traffic signal timing, dedicated transit lanes that keep buses moving, congestion pricing) deliver climate benefits alongside their obvious time-savings.
How commuting patterns themselves are shifting is covered in urban commuting trends.
The Mode-Shift Lever: Why It Beats Vehicle-Only Solutions
Two strategies exist for cutting urban transport emissions, and they are not equally powerful:
- Cleaner vehicles (EVs replacing gas cars) reduces emissions per car-mile, which matters and is genuinely happening — see our electric car carbon footprint guide.
- Mode shift (moving trips from cars to transit, walking, cycling) reduces the NUMBER of car-miles entirely, which compounds with vehicle electrification rather than competing with it.
Cities that pursue both simultaneously — electrifying vehicle fleets while investing in transit and active-transport infrastructure — see the largest urban transport emissions reductions in practice. Neither strategy alone matches what the combination achieves, because they attack different parts of the same equation (emissions per mile vs total miles driven).

What Individual Choices Actually Move the Needle
- Shift routine short trips to walking, cycling or transit where genuinely feasible — these carry near-zero marginal emissions.
- Combine errands into fewer car trips to reduce cold-start emissions and total distance.
- Support transit and bike-infrastructure investment at the city-policy level — individual mode choice matters more when good alternatives actually exist.
- Choose an EV for necessary car trips — the vehicle-electrification half of the equation still matters, it’s just not the whole answer alone.
Urban Transport Emissions FAQ
Where and how a city grows matters just as much \u2014 see the link between urban sprawl and carbon emissions.
Mode choice matters at the individual level too \u2014 see the honest public transport vs cars comparison.
- EV road trip calculator — the intercity counterpart: how many charging stops a long drive needs, and what it costs.
What percentage of a city’s emissions come from transport?
Typically 20-30% of a city’s total carbon footprint, though this varies by city depending on industrial base, building stock and transport infrastructure. Within that share, private cars usually dominate.
Do cars really produce most urban transport emissions?
Yes, disproportionately – private cars often account for 50-70% of a city’s transport emissions while carrying a minority of total trips in dense cities, because cars are far less emissions-efficient per passenger than transit, walking or cycling.
Does traffic congestion actually increase emissions?
Yes – stop-and-go driving burns meaningfully more fuel per mile than free-flowing traffic due to inefficient low-speed operation and constant acceleration. Congestion-reduction measures deliver real emissions benefits alongside time savings.
Is switching to EVs enough to fix urban transport emissions?
It helps significantly but isn’t the whole answer – EVs reduce emissions per car-mile, while mode shift (moving trips to transit, walking, cycling) reduces total car-miles. Cities pursuing both see the largest combined reductions.
Why do transit and cycling produce so much less emissions per trip?
Buses and trains at capacity carry many passengers per vehicle, dramatically lowering emissions per passenger-mile compared to a car carrying one or two people. Walking and cycling produce essentially zero transport emissions.
What can one person actually do about urban transport emissions?
Shift feasible short trips to walking, cycling or transit, combine errands into fewer car trips, and choose an EV for necessary driving. Supporting transit and bike-infrastructure investment at the policy level amplifies what individual choices can achieve.
Related Guides on ZeroCarbonDrive
- Connected vehicles — smart infrastructure that reduces congestion-driven emissions
- Electric car carbon footprint — the vehicle-electrification half of the equation
- CO2 emissions by country — how transport fits national totals
City drivers hit a practical obstacle before any of this applies: most have nowhere to plug in overnight. Our guide to apartment EV charging covers the options when there is no garage, and the EV charging cost calculator shows how much the charging mix changes the annual bill.
Sources and Further Reading
bike friendly city design is worth a closer look if you want the full picture.
green urban travel hacks is worth a closer look if you want the full picture.
micro-mobility trip data is worth a closer look for the full picture.
rail transportation innovations is worth a closer look for the full picture.
AI traffic management is worth a closer look for the full picture.
IoT-driven emissions reduction is worth a closer look for the full picture.
urban emissions and heat is worth a closer look for the full picture.
how traffic increases CO2 is worth a closer look for the full picture.
carbon emissions in transportation is worth a closer look for the full picture.
policy for sustainable transport is worth a closer look for the full picture.
Every figure on this page is dated and linked to its source. How we verify · Editorial policy · Report a correction
Related Posts


Leave a Comment
Your comment will be published after it has been approved. Please send comments that do not contain slang words.