
Urban Micro-Mobility Guide
Updated September 18, 2026 · 3 min read
- Urban micro mobility guide basics: e-scooters, shared bikes, and e-bikes now carry 150 million trips a year across NACTO member cities in the US.
- Micro-mobility works best for the same short trips that are hardest to serve efficiently with cars or even transit — under 3 miles.
- Trip volume has grown steadily since 2019, but financial sustainability of shared fleets remains an open challenge for many cities.
- The main emissions win comes from replacing short car trips, not from micro-mobility devices themselves being “green.”
This urban micro mobility guide covers what’s actually replacing short urban car trips today: shared e-scooters, dockless and docked bikes, and e-bikes. NACTO member cities logged 150 million trips on these systems in 2025 — up from 147 million at the previous 2019 peak, after a pandemic dip and recovery.

The Current Numbers
| Metric | Figure |
|---|---|
| NACTO member city trips, 2025 | 150 million |
| Bike + scooter share trips, 2023 (record year) | 157 million |
| E-scooter trips, US/Canada, 2023 | 69 million (up 15% from 58.5M in 2022) |
| Avg. e-scooter utilization, Sept 2025 | 2.9 trips/scooter/day (up to 8/day in top systems like Vancouver) |
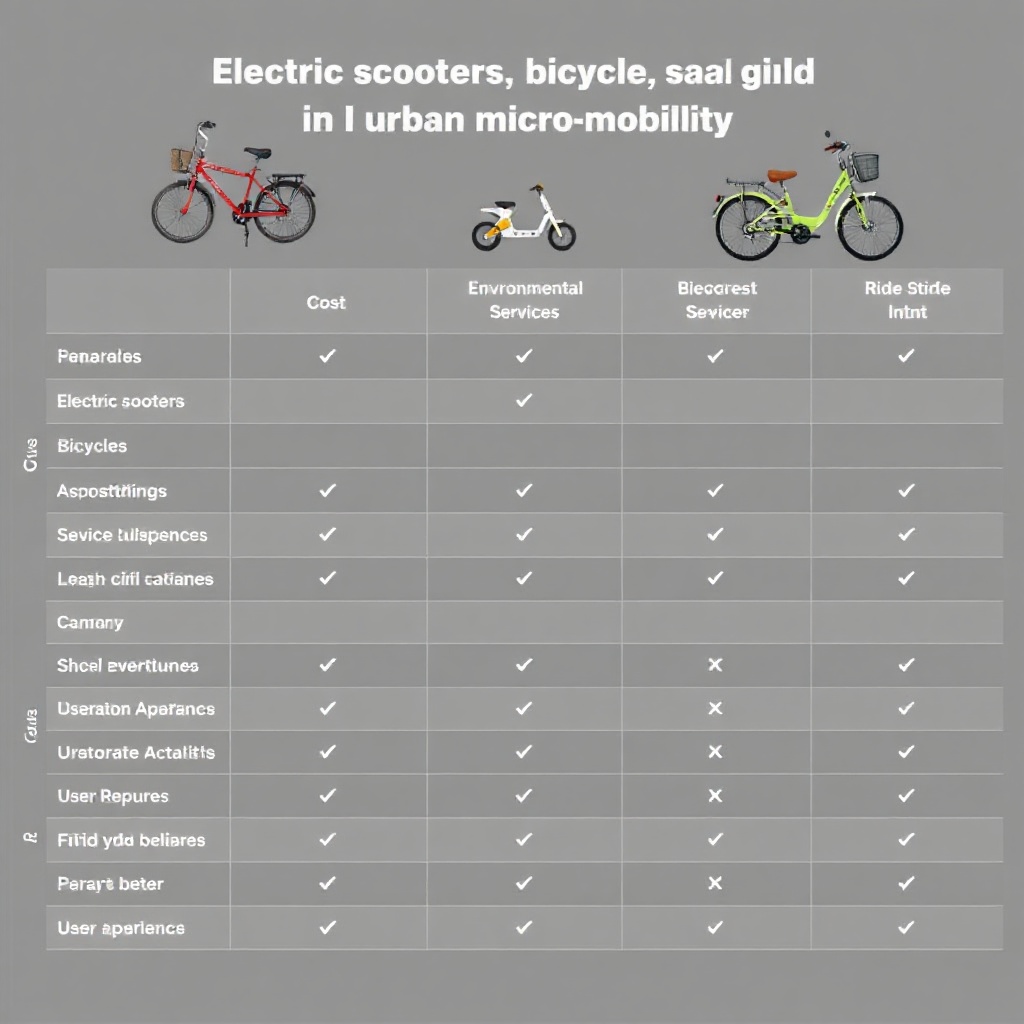
Which Device Fits Which Trip
| Device | Best-fit trip length | Trade-off |
|---|---|---|
| Shared e-scooter | Under 1.5 miles | Fast to grab, but shorter range and less stable in bad weather |
| Dockless/docked bike share | 1-4 miles | More stable, works in more weather, but slower than a scooter |
| Shared e-bike | 2-6 miles | Handles hills and longer distances better, costs more per trip |
Why Micro-Mobility Matters for Emissions
The honest framing: an e-scooter or shared bike isn’t “green” by itself — the emissions win comes entirely from what trip it replaces. A scooter trip that replaces a 1-mile solo car trip removes real tailpipe and well-to-wheel emissions from that trip. A scooter trip that replaces a walk adds emissions from manufacturing and charging, with zero car-trip offset. Cities that see the biggest climate benefit are the ones where micro-mobility genuinely displaces short car trips, not just shifts between other low-emission modes.
The Financial Sustainability Problem

Growing ridership hasn’t solved the industry’s cost problem. As fleets electrify and operating costs climb — vehicle replacement, charging logistics, vandalism, staffing — many cities and operators are struggling to keep funding and staffing paced with demand. This is the main reason some cities have seen shared systems shrink or pull out entirely even as national ridership grows.
What Makes a System Actually Work

- Dense, well-placed docking/parking zones — friction at pickup or drop-off kills ridership fast.
- Integration with transit — the best-performing systems connect to transit stops, extending the “last mile” rather than competing with buses/trains.
- Protected bike/scooter lanes — safety infrastructure drives usage the same way it drives cycling rates generally.
Urban Micro Mobility Guide: One-Minute Recap
- 150 million micro-mobility trips in NACTO cities in 2025, close to the 2023 record of 157 million.
- Match the device to the trip: scooter under 1.5mi, bike 1-4mi, e-bike 2-6mi.
- Emissions benefit only counts when a trip replaces a car trip, not a walk.
- Financial sustainability, not ridership demand, is the industry’s real bottleneck.
AI-optimized traffic systems is worth a closer look for the full picture.
How many micro-mobility trips happen in US cities?
NACTO member cities recorded 150 million shared bike and scooter trips in 2025, close to the 2023 record of 157 million trips.
Do e-scooters actually reduce emissions?
Only when they replace a car trip. An e-scooter trip that replaces walking adds manufacturing and charging emissions with no car-trip offset, while one that replaces a short car trip produces a real net emissions reduction.
What trip distance is best for an e-scooter versus a bike share?
E-scooters work best under about 1.5 miles, dockless or docked bike share for 1-4 miles, and shared e-bikes for longer 2-6 mile trips or hilly terrain.
Why do some cities lose their shared scooter or bike systems?
Financial sustainability, not demand, is usually the cause — rising fleet electrification costs, vandalism, and staffing needs often outpace city and operator funding even as ridership grows.
Does micro-mobility work well with public transit?
Yes, the best-performing systems are placed to extend transit’s “last mile” — connecting riders to stations — rather than competing directly with bus and train routes.
Are protected lanes important for micro-mobility ridership?
Yes. Safety infrastructure drives micro-mobility usage the same way protected bike lanes drive cycling rates — dense, safe docking zones and lanes are consistently linked to higher-performing systems.
Sources and Further Reading
- NACTO: Shared Micromobility in NACTO Member Agencies — 2025 Trends
- NACTO: A Micromobility Record — 157 Million Trips in 2023
- Argonne National Laboratory: Shared and Ownership Mobility Technologies in the US
Every figure on this page is dated and linked to its source. How we verify · Editorial policy · Report a correction
Related Posts


Leave a Comment
Your comment will be published after it has been approved. Please send comments that do not contain slang words.