
Public Transport Carbon Footprint
Updated September 18, 2026 · 5 min read
In today’s world, the impact of public transport on the environment is a critical issue that cannot be ignored. The Public Transport Carbon Footprint is a key metric that measures the amount of greenhouse gas emissions generated by public transportation systems. By understanding the carbon footprint of public transport, we can make informed decisions to reduce emissions and create a more sustainable future.
Table of Contents
- Carbon Emission Measurement
- Impact of Diesel vs. Electric Emissions
- Smart Traffic Systems
- Urban Mobility Trends
- Regional Comparison
- Frequently Asked Questions
Carbon Emission Measurement
Measuring the carbon footprint of public transport involves assessing the total amount of greenhouse gas emissions produced by various modes of transportation. These emissions are typically measured in grams of carbon dioxide equivalent per passenger-kilometer traveled (gCO2e/pkm). This metric takes into account the full lifecycle of emissions, including those from production, operation, and disposal of vehicles.
- Public transport systems play a crucial role in reducing overall emissions compared to individual car usage.
- Efforts to improve the energy efficiency and sustainability of public transportation can significantly lower the carbon footprint.
- Integrating cleaner energy sources, such as electricity or hydrogen, can further reduce emissions from public transport.
- Investments in infrastructure and technology are key to monitoring and reducing carbon emissions in the transportation sector.
Impact of Diesel vs. Electric Emissions
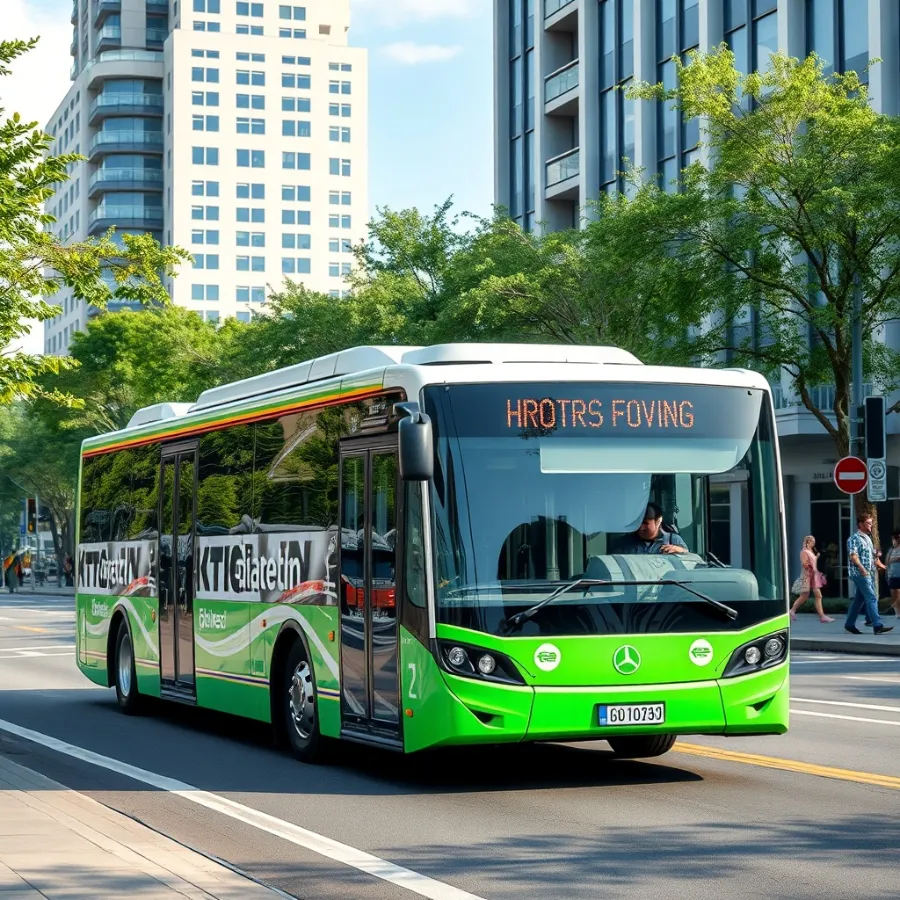
Diesel and electric vehicles have distinct carbon footprints when it comes to public transport. Diesel-powered buses, for example, emit pollutants like nitrogen oxides and particulate matter, contributing to poor air quality. On the other hand, electric buses produce zero tailpipe emissions and can be powered by renewable energy sources, significantly reducing their carbon footprint.
- Switching from diesel to electric buses can lead to substantial reductions in greenhouse gas emissions.
- Zero Carbon Drive provides detailed analysis on the emission differences between diesel and electric vehicles.
- Investments in electric charging infrastructure and battery technology are crucial for scaling up electric public transport fleets.
- Regulatory measures and incentives can promote the adoption of electric buses in public transport systems.
Smart Traffic Systems
Implementing smart traffic systems can enhance the efficiency of public transport networks and reduce overall carbon emissions. By utilizing real-time data and advanced algorithms, smart traffic systems can optimize routes, reduce congestion, and improve the utilization of public transport services.
- Smart traffic systems help minimize idle times for buses and trains, leading to fuel savings and lower emissions.
- By promoting multimodal transportation options, smart traffic systems encourage a shift towards more sustainable modes of travel.
- Zero Carbon Drive offers insights into the benefits of smart traffic systems in reducing carbon footprint.
- Integration of smart traffic systems with public transport apps can enhance user experience and promote eco-friendly travel choices.
Urban Mobility Trends
Urban areas are experiencing shifts in mobility patterns, with a growing emphasis on sustainable transportation solutions. Initiatives such as bike-sharing programs, pedestrian-friendly infrastructure, and electric scooter rentals are transforming urban mobility and reducing reliance on carbon-intensive modes of transport.
- Emerging trends in urban mobility emphasize the importance of reducing individual car usage and promoting shared transportation options.
- Electric vehicles play a significant role in urban mobility trends, offering a cleaner and more sustainable mode of transport.
- Zero Carbon Drive examines the latest developments in urban mobility and their impact on carbon emissions.
- Collaborative efforts between governments, transportation agencies, and private sector players are essential for shaping future urban mobility trends.
Regional Comparison
- US: The United States is investing in electric public transport to reduce emissions and combat climate change.
- EU: The European Union is focused on developing sustainable transport policies to achieve carbon neutrality.
- China: China is rapidly expanding its electric public transport infrastructure to address air pollution concerns.
- India: India is exploring innovative solutions to improve public transport efficiency and reduce emissions in major cities.
Bus vs Car Pollution: The Real Numbers
The most common commuting question deserves a direct answer. Per passenger-kilometer, a reasonably occupied bus emits far less CO2 than a solo-driven gasoline car — typical lifecycle estimates from agencies such as the IEA and EPA place the gap at roughly two to three times in the bus’s favor:
| Mode | Typical CO2 per passenger-km | Assumption |
|---|---|---|
| Gasoline car, driver only | ~170–190 g | Average sedan, single occupant |
| Gasoline car, 3 occupants | ~60–65 g | Same car, footprint shared |
| Diesel city bus, average load | ~80–105 g | Mixed urban service |
| Diesel bus, well loaded | ~30–50 g | Peak-hour occupancy |
| Electric bus (average grid) | ~20–60 g | Falls further as grids decarbonize |
| Urban rail / metro | ~25–45 g | Electric, high capacity |
These are directional estimates — exact figures vary with vehicle age, fuel, occupancy, and grid mix — but the ordering is robust across studies: a solo car ride is the most carbon-intensive common way to move one person through a city, and bus pollution per rider drops sharply as seats fill.
Public Transportation vs Cars: When Transit Wins — and When It Doesn’t
Occupancy is the whole story. A packed bus at rush hour is one of the cleanest motorized options on the road; a nearly empty late-night bus can emit more per passenger than a small car with two people in it. Three honest rules of thumb:
- Transit wins big on busy corridors and at peak times — exactly where most commuting happens.
- Carpooling closes the gap: a car with three or four occupants competes with an averagely loaded bus.
- Electric changes the math again: e-buses and metros on cleaner grids beat even full carpools, and their advantage grows every year the grid gets greener.
Air quality adds a second dimension beyond CO2: buses concentrate emissions on fewer engines that are easier to regulate and electrify, while thousands of individual tailpipes distribute nitrogen oxides and particulates along every street where people breathe.
Cutting Your Commute Footprint: A Practical Ladder
| Step | Typical CO2 saving vs solo driving |
|---|---|
| Switch 2–3 weekly trips to bus or rail | 20–40% of commute emissions |
| Carpool with one colleague | ~50% instantly |
| Move fully to transit on a busy route | 50–70% |
| E-bike or walk short trips | ~100% of those trips |
Related guides: Carbon Footprint Of Public Transit, Public Transport vs Cars and public transport vs car emissions.
Frequently Asked Questions
How can public transport contribute to reducing carbon emissions?
Public transport offers a sustainable alternative to individual car travel, leading to lower overall emissions and improved air quality.
What role do electric vehicles play in public transport sustainability?
Electric vehicles have the potential to significantly reduce carbon emissions in public transport systems, especially when powered by renewable energy sources.
Is investing in public transport infrastructure cost-effective for reducing carbon footprint?
Investments in public transport infrastructure are crucial for long-term emission reductions and creating more sustainable transportation networks.
Why are smart traffic systems important for lowering carbon emissions in public transport?
Smart traffic systems optimize the efficiency of public transport services, leading to reduced congestion, lower emissions, and enhanced passenger experiences.
TAGS: public transport, carbon footprint, emissions reduction, sustainable transportation, urban mobility, smart traffic systems
Sources and Further Reading
Every figure on this page is dated and linked to its source. How we verify · Editorial policy · Report a correction
Related Posts

1 Comment
Reduced my carbon footprint with public transport! Great info on emissions & sustainability. Easy to understand & make changes.
Leave a Comment
Your comment will be published after it has been approved. Please send comments that do not contain slang words.