
Carbon Emissions Historical Timeline: The Real Numbers
Updated September 18, 2026 · 2 min read
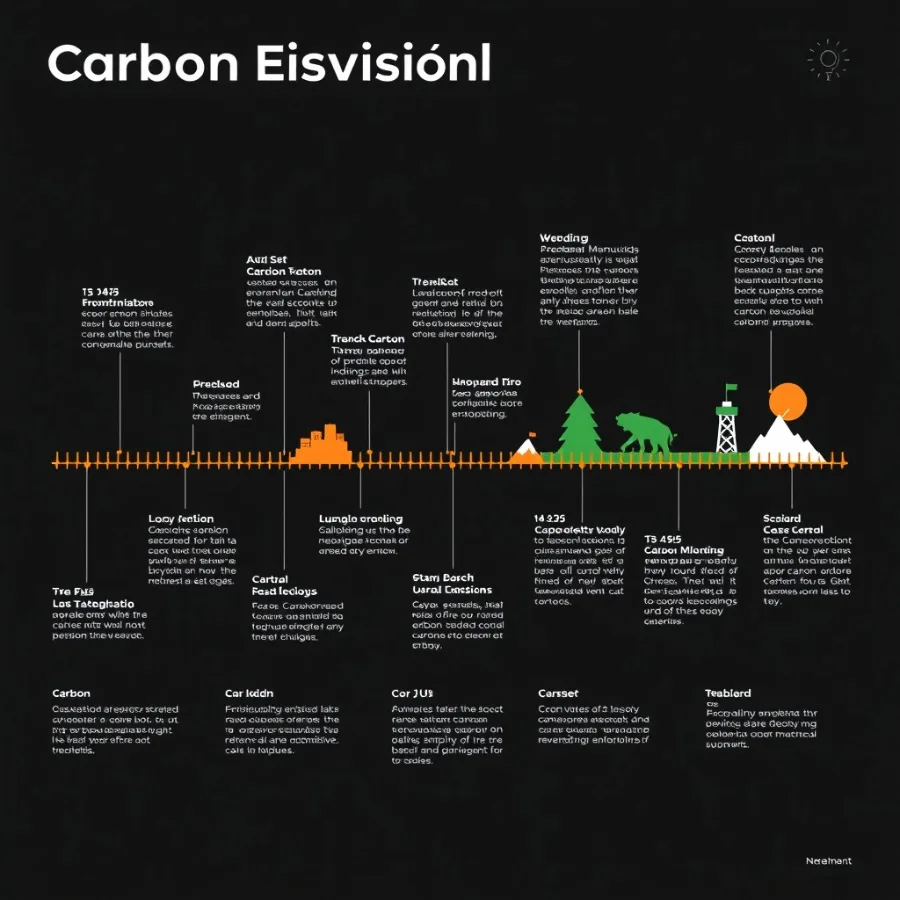
The carbon emissions historical timeline tells a story of two distinct eras: relatively slow, localized growth from the start of the Industrial Revolution through the mid-20th century, followed by a dramatic acceleration after World War II as global population, industrialization, and fossil fuel use all expanded together — more than half of all cumulative human CO2 emissions in history have occurred since 1990.
- Global emissions grew relatively slowly from the 1750s Industrial Revolution start through around 1950, then accelerated dramatically afterward.
- More than half of all cumulative historical CO2 emissions have occurred since 1990, despite emissions having already been rising for over two centuries by then.
- Emissions growth has shifted geographically — historically dominated by Europe and North America, increasingly driven by industrializing economies in recent decades.
- Annual emissions growth has slowed in percentage terms in recent years, though absolute levels continue rising, an important nuance often lost in headline summaries.
The carbon emissions historical timeline at a glance
| Period | Emissions pattern | Key driver |
|---|---|---|
| 1750s-1900 | Slow, gradual growth | Early industrialization, coal use in Europe/North America |
| 1900-1945 | Continued gradual growth | Expanding industrialization, early oil use |
| 1945-1990 | Sharp acceleration | Post-war industrial boom, rising global population |
| 1990-present | Continued high growth, more geographically distributed | Globalization, industrializing economies, over half of all cumulative emissions occur in this period |
Why the post-1990 period matters so much
A statistic that often surprises people: despite carbon emissions having already been rising for roughly two and a half centuries by 1990, more than half of all cumulative human CO2 emissions in history have occurred since that year. This reflects both the sheer scale of global industrial and economic growth over the past three-plus decades and the fact that earlier emissions, while environmentally significant, were smaller in absolute terms relative to the scale industrial economies eventually reached.
How the geography of emissions has shifted
For most of the industrial era, Europe and North America dominated global emissions, reflecting where industrialization happened first and most intensively. Recent decades have seen a significant geographic shift, with industrializing economies accounting for a growing share of annual emissions as manufacturing, energy demand, and economic development expanded rapidly in these regions — though cumulative historical emissions (the total contributed over time) still skew heavily toward the earlier-industrializing economies, an important distinction from annual current-year emissions.
The nuance behind recent growth rates
Annual global emissions growth has genuinely slowed in percentage terms in recent years compared to the rapid growth of previous decades, a real and meaningful trend. However, this doesn’t mean absolute emissions are falling — slower percentage growth on an already-large base still means rising total emissions each year, a distinction that matters for accurately interpreting emissions trend headlines, which can sound more encouraging than the underlying absolute-level trajectory actually is.
Sources and Further Reading
Temperature is one of the clearest signals too \u2014 see the actual climate change temperature records.
When did global carbon emissions start rising significantly?
Emissions grew relatively slowly from the Industrial Revolution’s start in the 1750s through around 1950, then accelerated dramatically in the post-World War II era as industrialization and population both expanded rapidly.
How much of historical CO2 emissions happened recently?
More than half of all cumulative human CO2 emissions in history have occurred since 1990, despite emissions having already been rising for over two centuries by that point.
Has the geography of emissions changed over time?
Yes significantly — Europe and North America historically dominated global emissions, while recent decades have seen industrializing economies account for a growing share of annual emissions as their economic development accelerated.
Are global emissions growth rates slowing down?
In percentage terms, yes in recent years compared to earlier decades, but this doesn’t mean absolute emissions are falling — slower percentage growth on an already-large base still means total emissions keep rising each year.
Which countries have contributed the most historical emissions?
Cumulative historical emissions skew heavily toward earlier-industrializing economies in Europe and North America, even though current annual emissions increasingly come from a more geographically distributed set of countries.
Why does the historical emissions timeline matter for climate policy?
Understanding both cumulative historical contribution and current annual emissions informs international climate policy debates about responsibility and fair burden-sharing for future emissions reductions.
Every figure on this page is dated and linked to its source. How we verify · Editorial policy · Report a correction
Related Posts


Leave a Comment
Your comment will be published after it has been approved. Please send comments that do not contain slang words.