
Well-To-Wheel Emissions Explained
Updated September 26, 2026 · 5 min read
- Well to wheel emissions count fuel production PLUS combustion or grid generation — not just tailpipe output.
- A new gasoline car averages about 410g CO2 per mile well to wheel; a new EV averages about 110g, even after counting power-plant emissions.
- Grid cleanliness changes the EV number by region, but even on the dirtiest US grids EVs beat gasoline well to wheel.
- Tailpipe-only comparisons make gasoline cars look artificially better than they are — well to wheel is the honest metric.
Well to wheel emissions measure every greenhouse gas released to get a vehicle moving one mile — from pumping crude oil or generating electricity, all the way through combustion or battery discharge at the wheel. It’s the only fair way to compare a gasoline car to an electric one, because it counts the full energy supply chain instead of stopping at the tailpipe.
What Well to Wheel Actually Measures
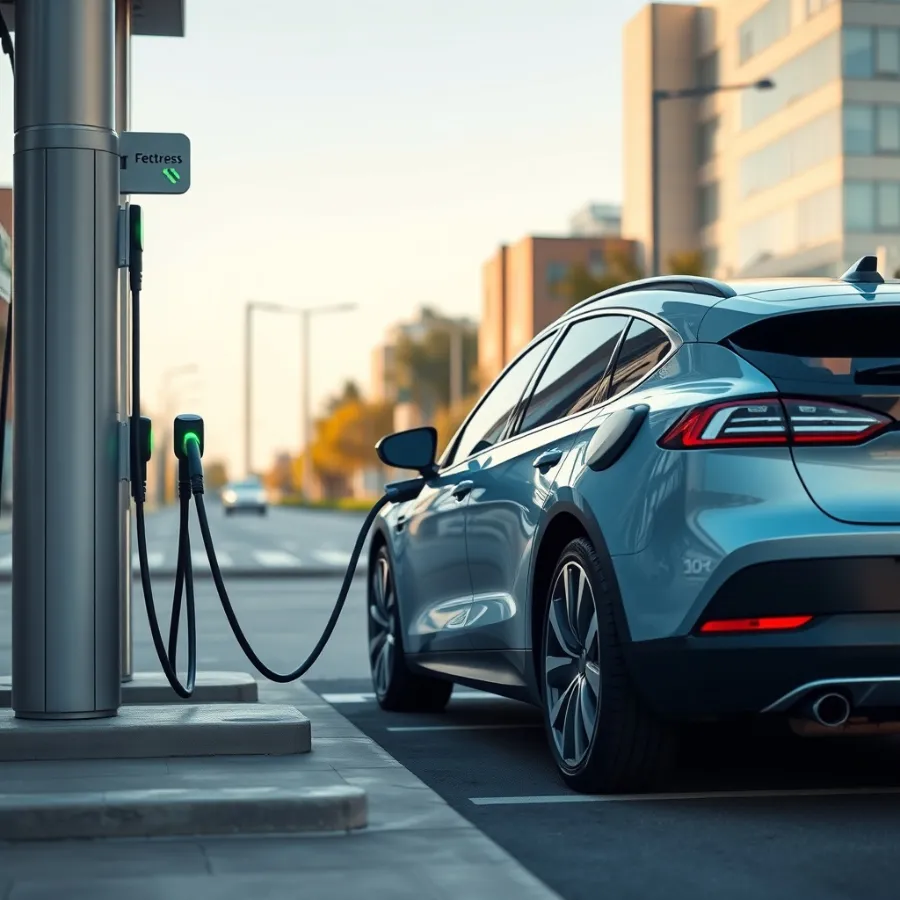
The term splits into two stages. “Well-to-pump” (or well-to-tank) covers everything before the fuel reaches the vehicle: drilling, refining, and shipping gasoline, or generating and transmitting electricity. “Pump-to-wheel” (tank-to-wheel) covers what happens inside the vehicle — combustion in an engine, or battery discharge through an electric motor. Add the two together and you get well to wheel emissions: the true climate cost of driving a mile, regardless of powertrain.
This distinction matters because a lot of casual EV-vs-gas debate only looks at pump-to-wheel — an EV has zero tailpipe emissions, full stop, which sounds perfect but ignores where the electricity came from. Well to wheel forces an apples-to-apples comparison.
Gasoline Cars: Where the Emissions Come From
| Stage | Share of well to wheel total | What’s included |
|---|---|---|
| Well-to-pump (upstream) | ~15-20% | Extraction, refining, transport of crude oil into gasoline |
| Pump-to-wheel (tailpipe) | ~80-85% | Combustion emissions from burning gasoline in the engine |
For gasoline, most of the climate damage happens at the tailpipe — refining and distribution add a real but smaller share on top.
Electric Vehicles: Why the Grid Mix Matters

| Grid type | Well to wheel emissions | Notes |
|---|---|---|
| National US average grid | ~110-130g CO2/mile | Mixed coal, gas, nuclear, renewables |
| Coal-heavy regional grid | ~180-220g CO2/mile | Still beats or ties an efficient gasoline hybrid |
| Clean grid (hydro/nuclear/wind-heavy) | ~30-60g CO2/mile | West Coast, Northeast, Pacific Northwest examples |
An EV has zero pump-to-wheel emissions by definition — everything on its side of the ledger is well-to-pump, meaning power-plant generation. That number swings by region and by time of day, but it almost never erases the electric motor’s efficiency advantage over an internal combustion engine.
The Real-World Numbers
| Vehicle type | Well to wheel CO2 per mile | Source |
|---|---|---|
| New gasoline car (fleet average) | ~410g | EPA/UCS lifecycle analysis |
| New electric car (US grid average) | ~110g | EPA/UCS lifecycle analysis |
| Gasoline small SUV (2020 model) | ~429g | DOE/Argonne cradle-to-grave study |
| Equivalent EV small SUV, 300-mile range | ~48% lower than gasoline | Same study |
Put another way: driving the average EV sold in the US produces well to wheel emissions roughly equal to a hypothetical 100 mpg gasoline car — about a quarter of what an average new gasoline vehicle emits over the same mile.
Why Some People Get This Wrong
Two common mistakes inflate or deflate the comparison unfairly:
- Counting only tailpipe emissions makes EVs look infinitely better than they are (zero isn’t the real number) and makes gasoline hybrids look competitive when they aren’t, well to wheel.
- Using outdated grid-mix data understates how clean EVs have become as coal has left the grid — a 2015 coal-heavy grid comparison is stale in 2026.
How This Changes as Grids Get Cleaner

Well to wheel emissions for EVs improve automatically every year the grid adds renewables or retires coal plants — the same car gets cleaner without the owner doing anything. A gasoline car’s well to wheel number is fixed for its lifetime; refining efficiency barely moves. This is the structural reason EVs pull further ahead over time rather than staying flat.
Practical Takeaway for Buyers
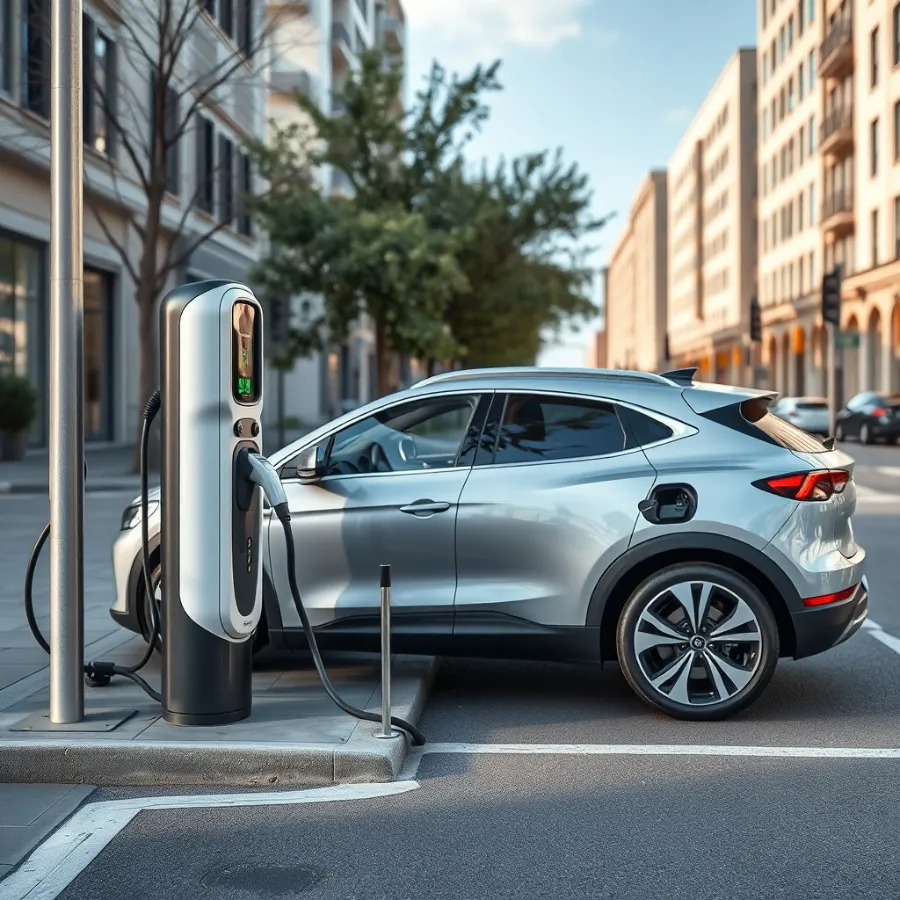
If you’re weighing a gasoline car against an EV and want an honest environmental comparison, ask about well to wheel emissions, not tailpipe-only marketing numbers. Even on the dirtiest US grid, a new EV’s well to wheel footprint comes out ahead of a comparable new gasoline car — and that gap only grows as the grid cleans up.
One-Minute Recap
- Well to wheel = well-to-pump (fuel/power production) + pump-to-wheel (use in the vehicle).
- Gasoline: ~410g CO2/mile well to wheel. EV on average US grid: ~110g.
- Even coal-heavy grids don’t erase the EV advantage.
- EVs get cleaner every year automatically; gasoline cars don’t.
how EVs reduce CO2 is worth a closer look for the full picture.
What is the difference between well to wheel and tailpipe emissions?
Tailpipe emissions only count what comes out of the exhaust pipe while driving. Well to wheel emissions add everything upstream too — extracting and refining fuel, or generating and transmitting electricity — giving a complete picture of a vehicle’s climate impact.
Do electric vehicles really have lower well to wheel emissions than gas cars?
Yes. Even counting power-plant emissions, a new EV on the average US grid produces roughly 110g of CO2 per mile well to wheel versus about 410g for a new gasoline car — about a quarter as much.
Does the source of electricity change an EV’s well to wheel emissions?
Yes, significantly. An EV charged on a clean grid (hydro, nuclear, wind-heavy) can emit as little as 30-60g CO2/mile well to wheel, while one on a coal-heavy grid may emit 180-220g — still generally lower than a comparable gasoline car.
Why do well to wheel numbers for EVs keep improving?
As grids retire coal plants and add renewable generation, every EV already on the road gets cleaner automatically, because its well-to-pump emissions drop. A gasoline car’s well to wheel footprint stays essentially fixed for its lifetime.
Is well to wheel the same as full lifecycle emissions?
Not quite. Well to wheel covers fuel/energy production plus vehicle operation, but leaves out vehicle manufacturing (like battery production). Full lifecycle or cradle-to-grave analysis adds manufacturing and end-of-life on top of well to wheel.
Where does the 410g and 110g CO2 per mile figure come from?
These are EPA and Union of Concerned Scientists lifecycle-emissions estimates for new gasoline and electric passenger vehicles in the US, based on fleet-average fuel economy and the national grid mix.
Sources and Further Reading
- EPA: Greenhouse Gas Emissions from a Typical Passenger Vehicle
- US DOE Alternative Fuels Data Center: Emissions from Electric Vehicles
- Union of Concerned Scientists: EV Emissions Analysis
Every figure on this page is dated and linked to its source. How we verify · Editorial policy · Report a correction
Related Posts


1 Comment
"Understanding well-to-wheel emissions was eye-opening! It's crucial info for making eco-friendly transport choices."
Leave a Comment
Your comment will be published after it has been approved. Please send comments that do not contain slang words.